Stratsoft specializes in building and analyzing geo-spatial databases. The resultant data are often depicted as maps because this is an efficient and effective way for decision-makers to absorb and use large data-sets to decide and plan the future. Data can then be subjected to a variety of analysis routines that reveal new insights. These data can be viewed as multi-layered pdf files (see below) and can also be embedded into a secure web portal that includes data download and geo-analysis functions.
Northern VA
This single map shows many different market perspectives. Scroll through the presentation to see;
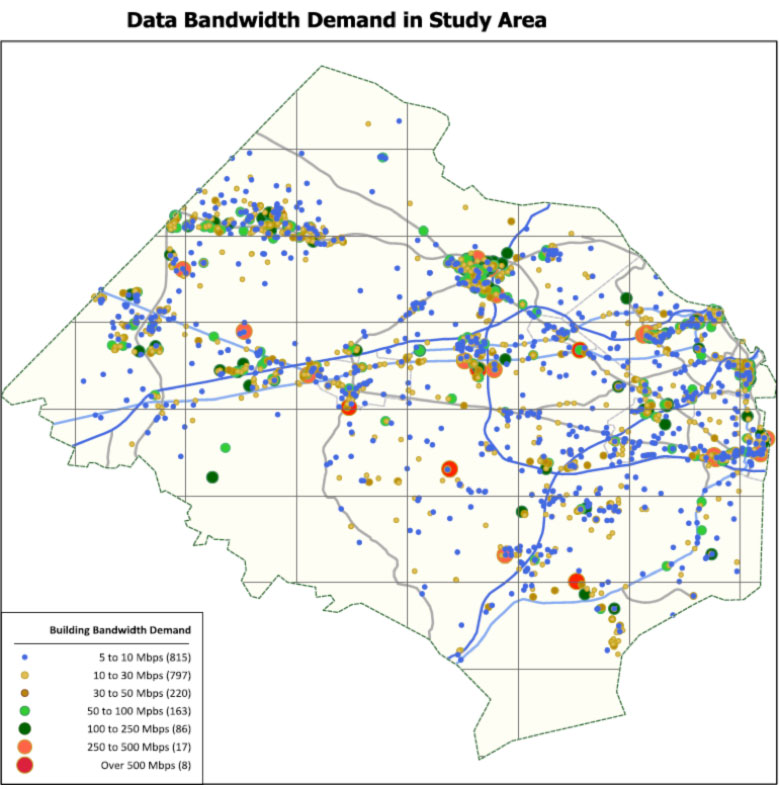
- Top Inset Map; Demand. Bandwidth usage by businesses in different buildings and their location and clustering with respect to fiber networks
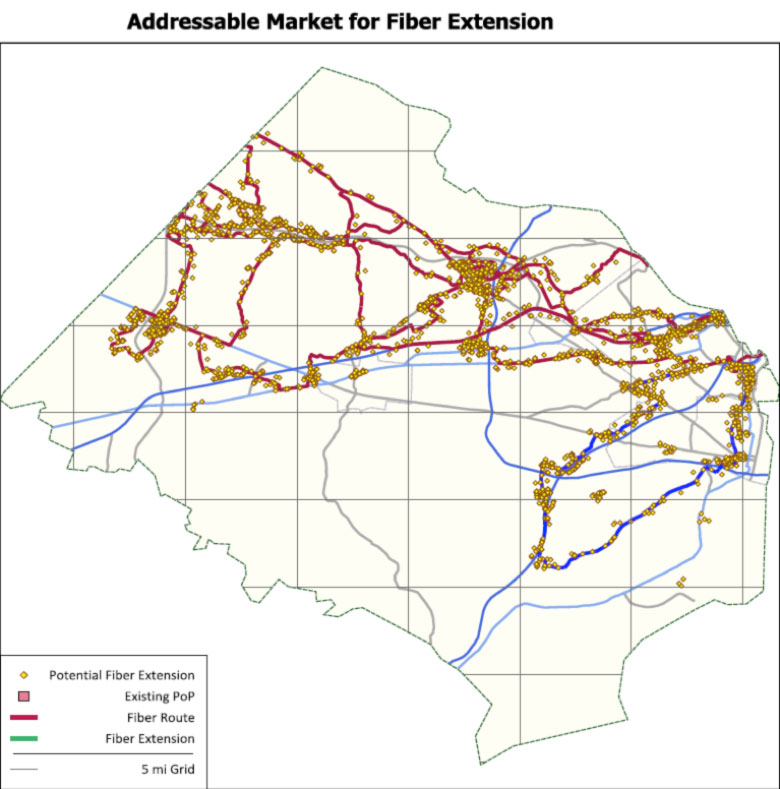
- Center Inset Map; Readily Addressable Demand. Businesses and buildings that can be economically addressed by the existing fiber network
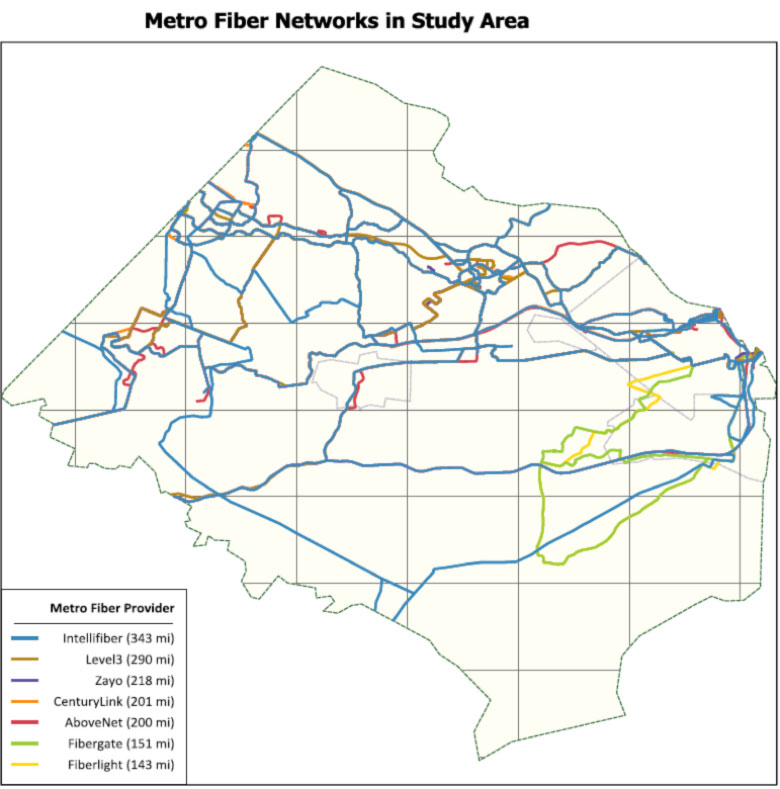
- Bottom Inset Map; Competition. The location and routes of different fiber network in the region.
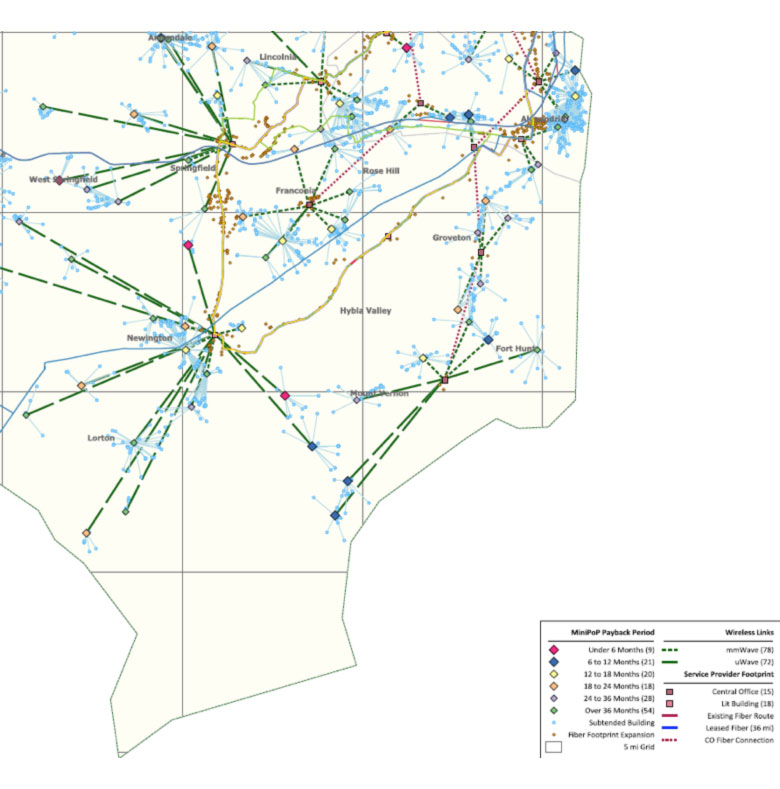
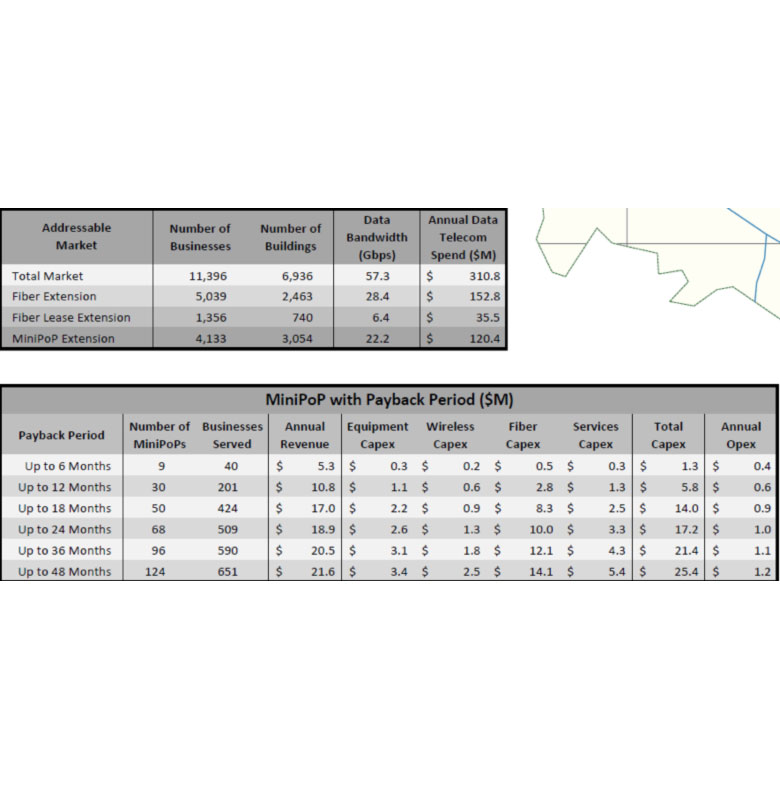
- Main Map; Network Design. Using a combination of fiber extension and microwave links this design reaches all the demand that can be cost justified according to the financial goals of the client. The photograph inset map shows that each microwave link has Line-Of-Sight (LOS) to the relevant target buildings. The summary tables quantify the number of extensions with different payback periods and thus provide a network extension priority and development path.
Network design to bring Ethernet Business Services (EBS) to buildings in Northern Virginia
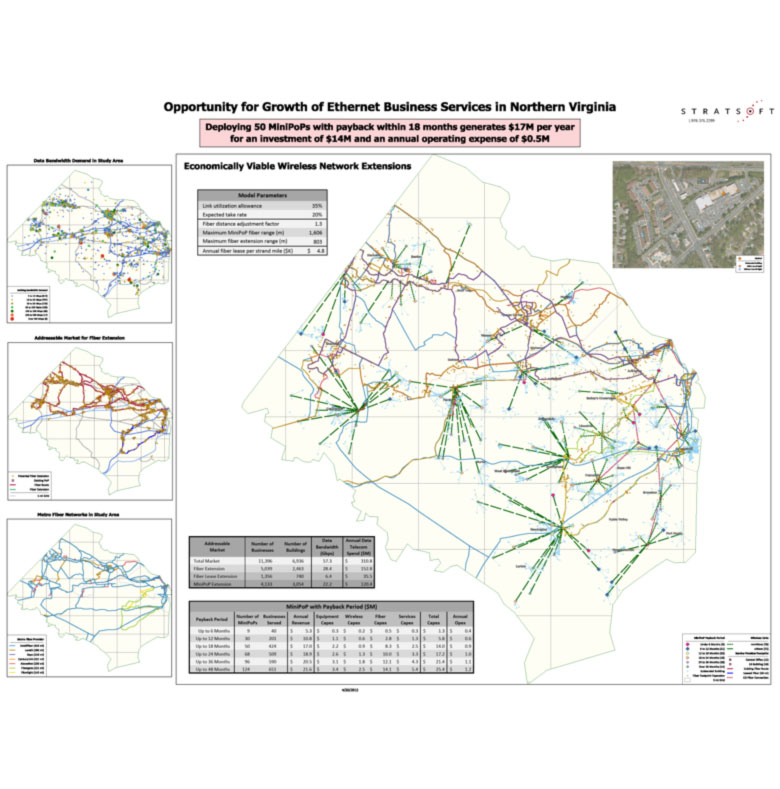
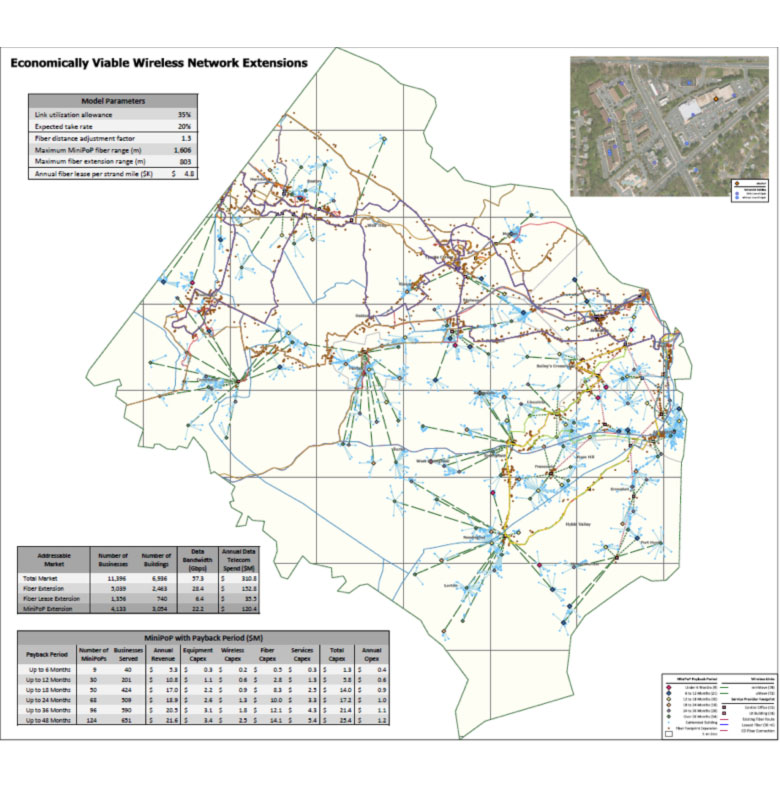
This composite map is available to the client with each data layer available to turn on/off to help explore different network extension strategies and a database with a linked economic model to explore different scenarios. The result is a network extension business plan with quantified cost/benefit analyses.
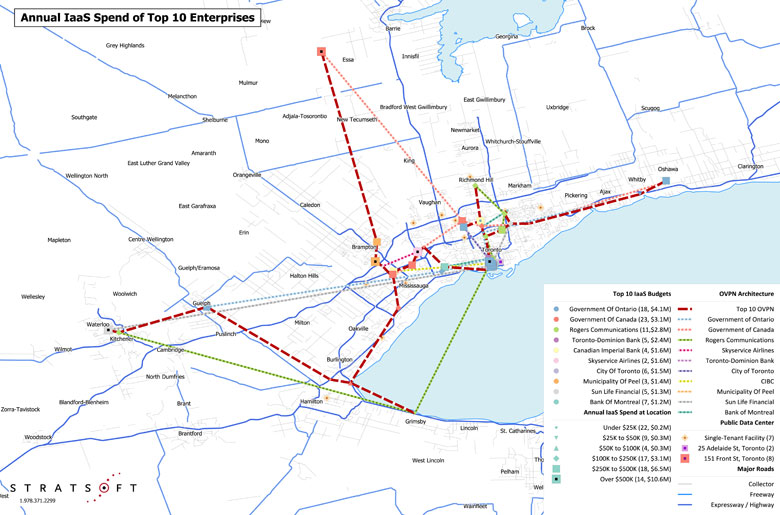
Connecting to major demand for Cloud Computing
This project allowed our client to evaluate how to provide networks to serve Cloud Computing demand. It identified, and quantified, specific locations of high IaaS demand in Toronto. Minimum spanning networks were then designed to serve each business as well as a network to serve the majority of locations (dotted red line) with an Optical Virtual Private Network (OVPN).” Note that the map needs to be adjusted for to be website-ready.
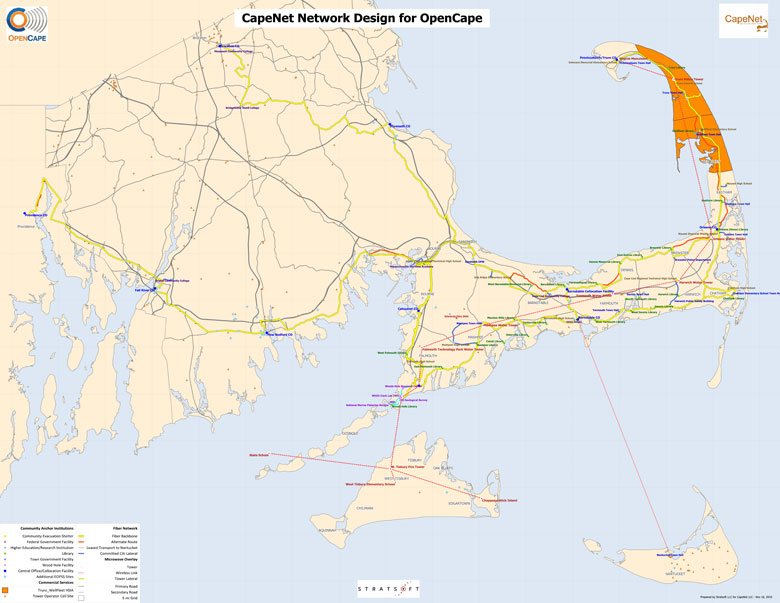
Bringing Broadband Fiber to Cape Cod and southern MA
This network design was developed as part of a successful submission for $24 million of Government Stimulus (BTOP) funding to build a 270 mile fiber network to bring broadband to an under-served region. With an associated Financial Forecast we were able to show how serving under-served community institutions with broadband could be combined with serving commercial demand to create a self-sustaining new business.
Serving businesses close to high bandwidth buildings
Stratsoft often provides data, maps and analysis for its clients as a secure portal on the web (view demo). This project identifies the demand for high capacity communications that are close to high bandwidth buildings and Data Centers. By overlaying the network ‘supply’ it can quickly be seen where network extensions can address the strongest demand. Stratsoft often embeds analytical algorithms within geo-spatial software to all its clients to view (and download) the data and to undertake analysis as required.