Stratsoft specializes in building and analyzing geo-spatial and geo-economic databases.
The resultant data are often depicted as maps because this is an efficient and effective way for decision-makers to absorb and use large data-sets.
Once the data are in an electronic form it can be subjected to a variety of analysis routines that reveal new insight such as;
- Proximity – how close is demand (customers) to supply (networks and service availability)
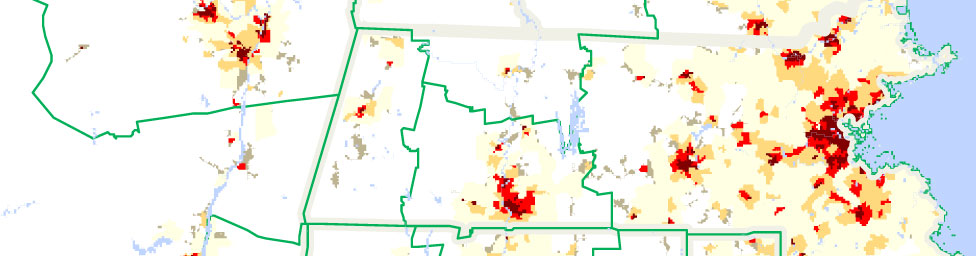
- Density – what is the relative concentration of target Customers and/or Competitors within any geographic region
- Direction & distance – developing detailed desktop plans of real distance (as opposed to straight line “Crow Flies” distance), establishing Line-of-Sight paths and overcoming obstacles (natural or man-made) provides realistic deployment costs
- Design – Daisy Chains, Tree & Branch, Redundant Rings are some examples of different network designs that have a material effect on cost/benefit and can be implemented according to the project needs.
- Time variance – How Supply & Demand varies over 24 hours, weeks, months
Our methods are based on rigorous quantitative methods developed over many years of practice. Stratsoft has originated a number of data development and analysis software programs to draw out new meaning and insight from data. We favor data that has high original reliability and cross-reference this with similar data in order to improve the integrity further.
Systematic, and often statistical, analysis combined with fully auditable data can yield powerful insight and a common information set that decision-makers can together use to plan strategy and represent opportunity to their stakeholders.